During the inspection and repair of the pipeline network of natural gas wells in the oil field, it was found that some weld roots and the inner wall of the base metal had corrosion pits. The main shapes were pitting and flaky corrosion, which constituted a great hidden danger to the safe operation of the pipeline. Therefore, it is necessary to prevent corrosion. In-depth measurement is used as the basis for RBI (Equipment Inspection Based on Risk Assessment) analysis. Traditional ultrasonic testing, phased array testing, eddy current testing and other technologies are often difficult to determine the corrosion depth of a small area of corrosion pits on the inner wall, and the measurement reliability of the corrosion pits in the weld and its adjacent areas is low.
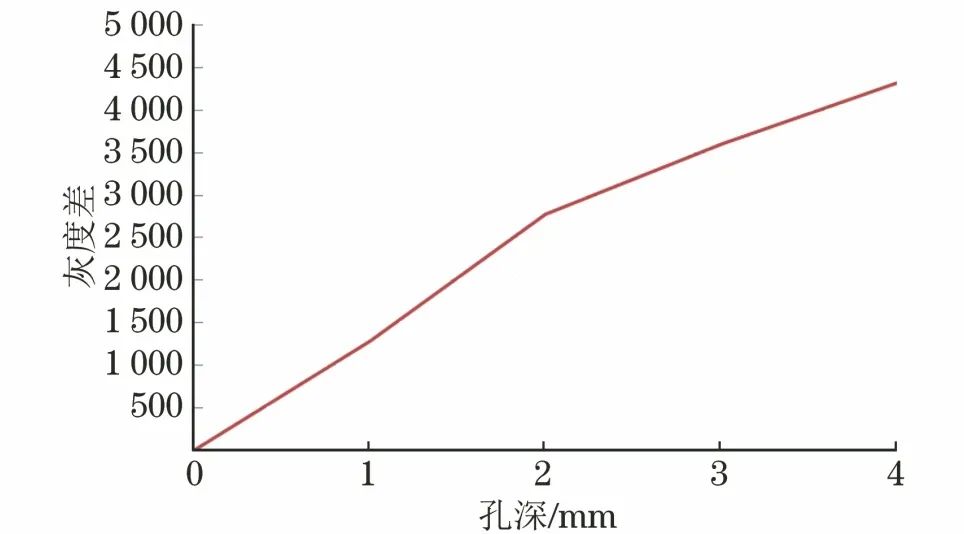
X-rays will be attenuated when they are incident on metal materials. The attenuation is a function of the penetration thickness. Digital X-ray photography (DR) technology can record different intensities of the penetration radiation to form a digital image. Using this principle, the technicians of Jilin Yaxin Engineering Inspection Co., Ltd. and Baotou Beiguo Nondestructive Testing Technology Co., Ltd. established a thickness-gray mathematical model through simulation tests, and calculated the corrosion pit depth using algorithms. Let us now Learn more about it.
1
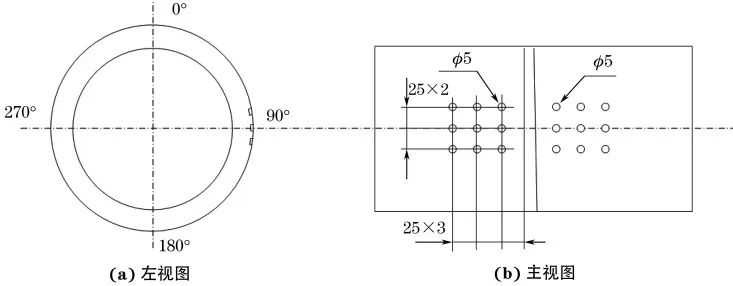
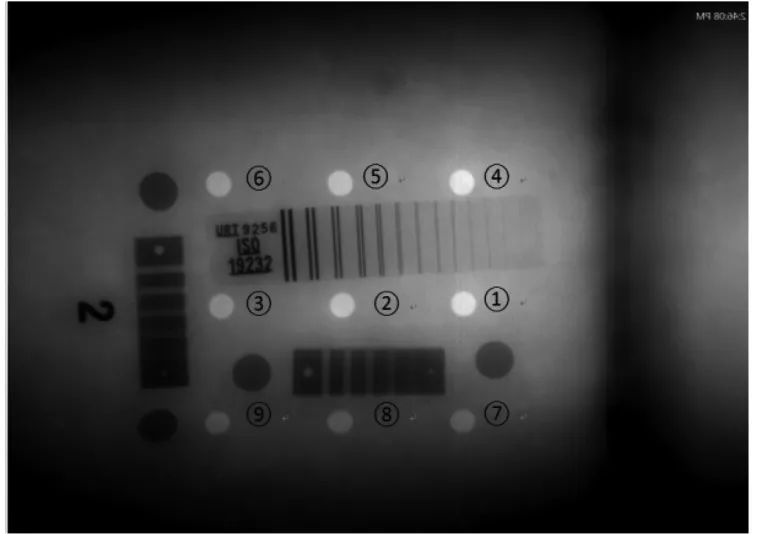
Simulation test
2
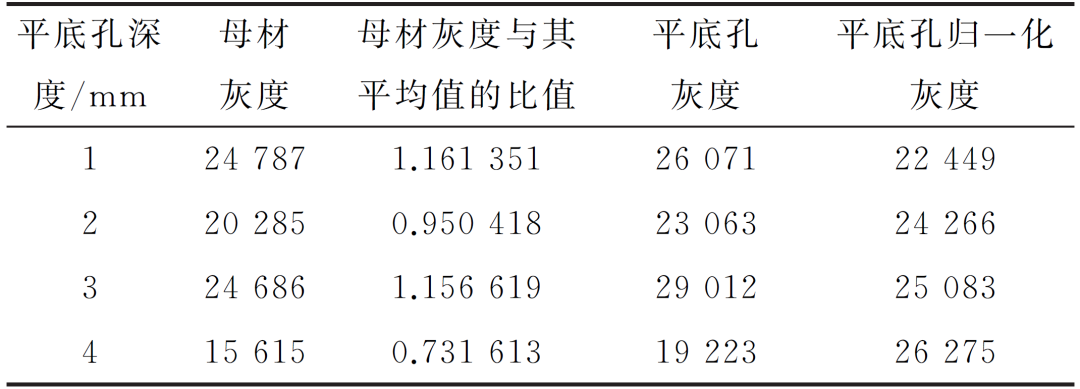
Data normalization processing
3
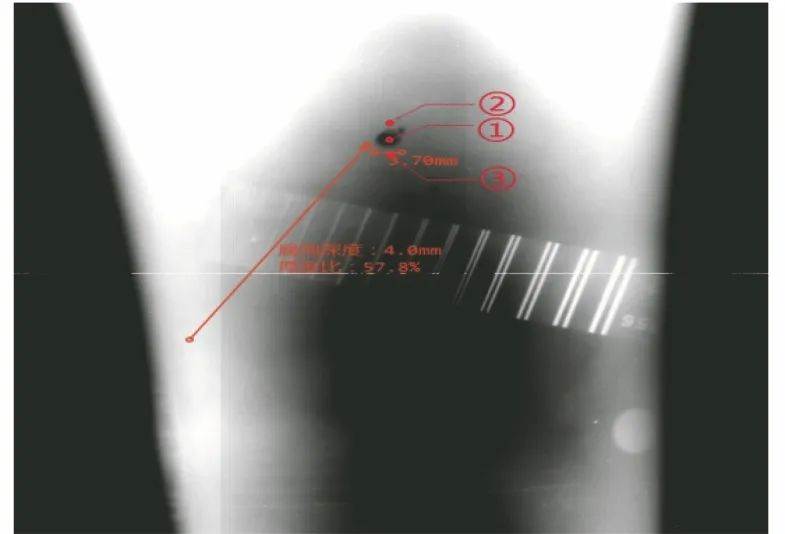
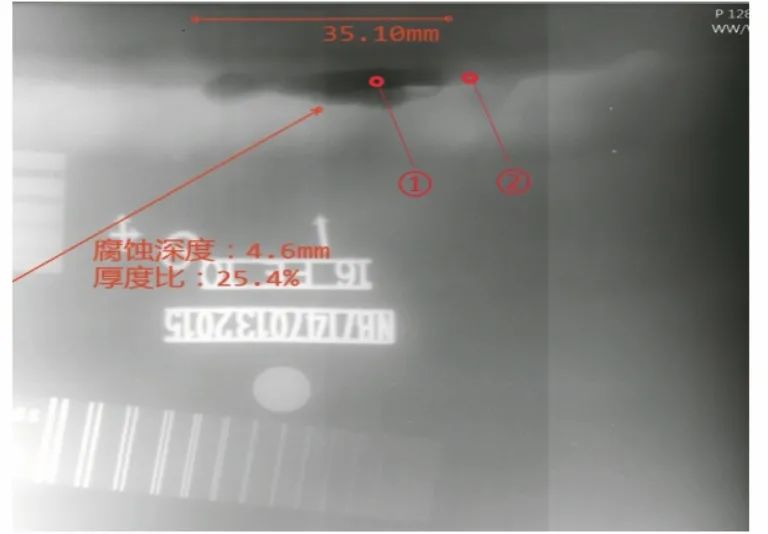
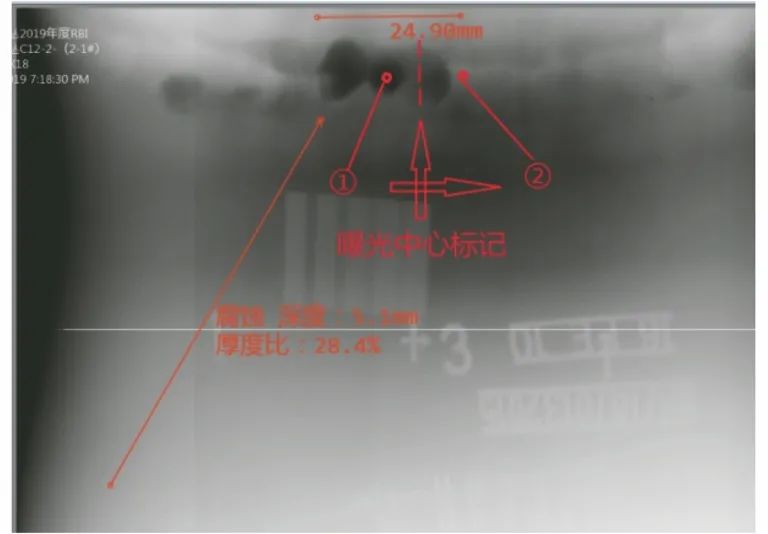
On-site inspection
Concluding remarks

 。
。