
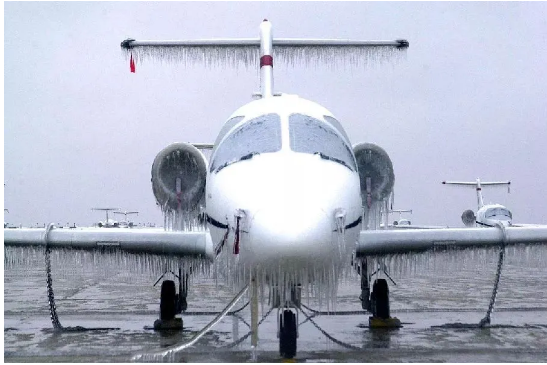
If the aircraft encounters supercooled water droplets in flight, the wing, tail, propeller, engine intake duct, windshield and other components will experience icing. The icing will change the flow characteristics of the gas near the components and affect the aerodynamics of the aircraft. And control performance, reduce the reliability of the aircraft during flight, and in serious cases, it will cause the consequences of aircraft destruction. Therefore, it is necessary to accurately detect the icing state of the aircraft's key components and effectively remove the icing of the aircraft to ensure the safe flight of the aircraft.
The sensors currently used for icing detection are mainly divided into electrical, optical, acoustic and so on. Common electrical sensors include capacitive sensors. Its working principle is to judge the medium between the electrodes according to the capacitance value, distinguish different media such as air, water, and ice, and detect the thickness of icing. The optical fiber sensor is a common optical icing sensor, which judges whether the component is icing according to the intensity of the infrared light received by the optical fiber. Acoustic sensors are usually made of sensitive elements such as magnetostrictive materials or piezoelectric ceramic materials, and have the advantages of low energy consumption, simple design, and easy installation. Ice accretion will change the vibration frequency of the ultrasonic guided wave excited by the acoustic sensor. According to the frequency change, it can be judged whether there is ice accretion in the component. Studies have shown that the use of ultrasonic guided wave technology to detect aircraft icing is effective, but because ultrasonic guided waves have multi-modal characteristics, accurate and reasonable selection of ultrasonic guided wave modes that are sensitive to icing is the key to effective detection.
1
Semi-analytical Finite Element Method for Solving the Propagation Law of Ultrasonic Guided Waves
The aircraft component with ice accretion is simplified as an ice-base two-layer flat structure. The ice accretion is an isotropic material, and the base is a metal aluminum material. The ice-aluminum plate finite element model is shown in Figure 1.

Figure 1 Finite element model of ice-aluminum plate
The elastic wave in the solid conforms to Navier's governing equation. The three-dimensional model is simplified to a two-dimensional model. The x-direction is the wave propagation direction, and the z-direction is the thickness direction. The conditions are as follows: the dispersion equation of the symmetric mode guided wave and the dispersion equation of the antisymmetric mode guided wave in the plate are:

In the formula: h is the plate thickness; ω is the angular frequency; k is the wave number; cL and cT are the wave speeds of the longitudinal and transverse waves in the solid, respectively.
The semi-analytical finite element method is used to solve the dispersion equation of the guided wave in the ice-aluminum plate structure, and the dispersion curve and the wave structure distribution can be obtained. The wave structure is the displacement, strain, stress and other wave fields corresponding to a point on the dispersion curve. The distribution of the function with the thickness.
There are three types of aircraft ice accumulation, namely frost ice, clear ice and mixed ice. The dispersion curves of 1mm thick aluminum plate, 1mm thick Mingbing-1mm thick aluminum plate are respectively solved as shown in Figure 2.

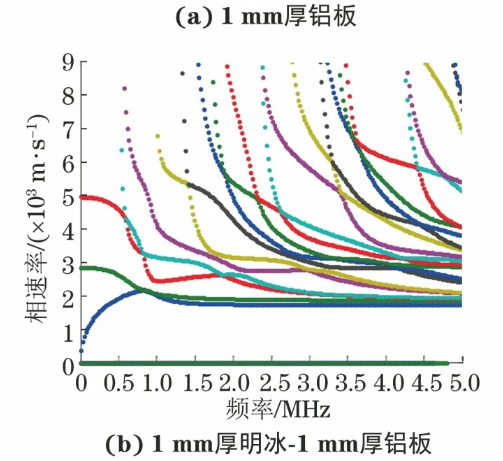
Figure 2 Dispersion curve of single-layer aluminum plate and ice-aluminum plate structure
It can be seen from Figure 2 that when 1mm thick ice appears on the surface of a 1mm thick aluminum plate, the dispersion curve changes significantly, the number of modes increases, the dispersion curve shifts to the left, and the phase velocity of each mode changes. This is mainly caused by the discontinuity of the material at the interface between the aluminum plate and the ice and the increase in the thickness of the overall structure. Based on this, it is feasible to use guided waves for icing detection.
Figure 4 Displacement field and amplitude distribution of modal 3-frequency 0.5MHz mode frequency point in aluminum plate2
The finite element simulation of ultrasonic guided wave multi-mode ice detection
Select multiple modal-frequency points within 0.25~5MHz on the dispersion curve of the 1mm thick aluminum plate to study the sensitivity of guided wave icing detection.
When guided waves propagate to the icy area, energy leakage will occur, leading to changes in the amplitude of the guided waves before and after the icing position, as well as wave mode conversion. The sensitivity of guided waves to icing can be characterized by the change in displacement amplitude after the guided waves pass through the icing area. The classification of sensitivity is as follows:
Not sensitive::
After the guided wave passes through the icy area, the displacement amplitude is basically unchanged, and the amplitude change is about less than 10%.
Generally sensitive:
After the guided wave passes through the icy area, the displacement amplitude changes to a certain extent, and the amplitude change is about 10% to 35%.
sensitive:
After the guided wave passes through the icy area, the displacement amplitude changes significantly, and the amplitude change is more than 35%.
The two-dimensional frequency domain simulation model of the ice-aluminum plate structure is shown in Figure 3. The solid mechanics physical field is selected for analysis. The size of the aluminum plate is: 150mm in length and 1mm in thickness; the size of the ice layer is: 20mm in diameter and 1mm in thickness, located at the center of the aluminum plate, and the type of ice is clear ice. There are no reflection boundary conditions at both ends of the model, and the excitation is located at the left end of the model.

Figure 3 Two-dimensional frequency domain simulation model of ice-aluminum plate structure
Load the displacement load along the thickness direction. The displacement load is a 5-period burst signal u(t), which is defined by the following formula:

In the formula: t is time; f is frequency.
The mesh is used to divide the unit into a free triangle mesh, and the mesh size is less than 1/10 of the wavelength.
The single-layer aluminum plate is simulated and analyzed to obtain the propagation of guided waves in the non-icing state. Taking the mode 3-frequency 0.5MHz as the excitation mode frequency point, the displacement field and amplitude distribution of the single-layer aluminum plate in the x and z directions are shown in Figure 4.


Figure 4 Displacement field and amplitude distribution of modal 3-frequency 0.5MHz mode frequency point in aluminum plate
For the ice-aluminum plate structure, the simulation results of the modal 3-frequency 0.5MHz mode frequency point are used for analysis. The displacement field and amplitude distribution in the x and z directions are shown in Figure 5, which can be seen as compared with the single-layer aluminum plate. After icing at the same location, the displacement field in the x and z directions both change, which is mainly manifested in the obvious attenuation of the displacement amplitude, the displacement amplitude in the x direction is attenuated by about 50%, and the displacement amplitude in the z direction is attenuated by about 80%. This shows that the guided wave at this mode frequency point is sensitive to icing.


Figure 5 Displacement field and amplitude distribution at modal 3-frequency 0.5MHz mode frequency point in ice-aluminum plate
In the same way, the sensitivity analysis results of all other mode frequency points are shown in Figure 6. From the figure, the sensitivity of each mode frequency point can be directly seen, which can provide theoretical basis and guidance for the icing detection test.

Figure 6 Sensitivity analysis results of all mode frequency points
The fundamental reason for the different sensitivity of mode frequency points to icing is that each mode frequency point has a unique wave structure. The wave structure can be expressed by the distribution of displacement along the thickness of the plate.
The experiment selects the wave structures of the three sensitivities corresponding to the mode frequency points for comparative analysis. The wave structures in the aluminum plate under different sensitivities are shown in Figures 7-9. It can be seen that the icing interface is sensitive to icing. For the mode frequency point, the displacement Ux (in-plane displacement) of the particle on the surface of the aluminum plate is dominant, that is, the in-plane displacement is greater than the out-of-plane displacement (Uz); for the insensitive and generally sensitive mode frequency points, the surface of the aluminum plate The in-plane displacement of the mass point is less than the out-of-plane displacement. Therefore, when using ultrasonic guided waves for icing detection, the mode frequency point where the in-plane displacement is dominant should be selected.

Figure 7 Wave structure of insensitive mode frequency point

Figure 8 Wave structure of general sensitive mode frequency points

Figure 9 Wave structure of sensitive mode frequency points
3
Ultrasonic guided wave icing detection test
Combined with the simulation results, for the air-aluminum plate and the bright ice-aluminum plate model, three modes of insensitive mode 3-frequency 1.5MHz, general sensitive mode 1-frequency 2.25MHz, and sensitive mode 3-frequency 0.5MHz were selected respectively. Point to conduct icing detection test to verify the correctness of the above-mentioned basic theory and icing detection method.
The oblique incidence-transmit-receive transducer is used to excite and receive ultrasonic guided waves at a specific mode frequency. The test system is shown in Figure 10. The dimensions of the tested aluminum plate are: length 300mm, width 250mm, thickness 1mm. After completing the air-aluminum plate test at room temperature of 25℃, prefabricate an icing zone with a diameter of 20mm and a thickness of 1mm in the refrigerator. The refrigerator temperature is set to -10℃. , Completed the test of the ice-aluminum plate in the refrigerator.

Figure 10 Ice detection test system


In summary, the test results of the sensitivity of guided waves to icing are basically consistent with the sensitivity results obtained by simulation. At the same time, the test observes that the peak time of the main wave packet of each mode frequency point signal is different, indicating that the peak time of the main wave packet can be As another indicator of icing sensitivity.
4
in conclusion
1
The semi-analytical finite element method is used to calculate the dispersion curves and wave structures of three types of ice-coated ice-aluminum plate structures, which proves the feasibility of using guided waves for icing detection.
2
Establish a finite element simulation model of ice-aluminum plate structure, analyze and determine the sensitivity of different mode frequency points to icing, and give the selection method of guided wave icing detection mode frequency points, that is, select the mode frequency dominated by the in-plane displacement point.
3
The guided wave icing detection test verifies its ability to detect icing on an aluminum plate with a diameter of 20 mm and a thickness of 1 mm; the icing sensitivity test results are basically consistent with the simulation results, which validates the method of selecting the frequency point of the guided wave icing detection mode reliability.
Authors: Yu Quanpeng, Zhou Shiyuan, Xu Chunguang, Yao Pengjiao, Hu Xiaodan, Zhao Minghua